
Debugging the Debugger & Response Pane
A complete overhaul of the current debugger in Appsmith
role
Senior Product Designer + Acting PM
engineers
2 Backend + 1 Frontend
timeline
Jan 2023 - April 2023
company
Appsmith (Data platform Pod)
tldr
3× Faster Error Discovery & Resolution
We redesigned Appsmith’s debugger to cut error discovery and solving time from 53s to 17s — and eliminated all secondary errors during debugging.
The Old Debugger: A Fragmented, Overwhelming Interface
Appsmith’s debugger and error feedback mechanisms are central to helping developers ship reliable internal tools.
However, user feedback and internal usability studies revealed a fragmented, inconsistent experience that made identifying and resolving issues frustrating — especially for users working with complex bindings, nested queries, or conditional logic.
Cluttered UX
Split tabs, extra clicks
Redundant collapse
Poor readability
Icons > info
Poor Navigation
No source links
Debugger only on canvas
Inspect Entity not helpful
Response pane logic unclear
Filtering & Grouping
Widget errors skipped
No error grouping
Inconsistent formats
Low Actionability
Raw JSON dumps
No CTAs or docs
Hidden clear logs button


Journey map
My role
I led the entire redesign — from identifying fragmented error patterns to delivering the final developer experience.
I spent weeks embedded with engineering teams, untangling undocumented error flows, mapping the full lifecycle of an Appsmith error, and building consensus across pods.
Every sketch, flowchart, and usability tweak came from firsthand investigation and relentless iteration.

Understanding the errors
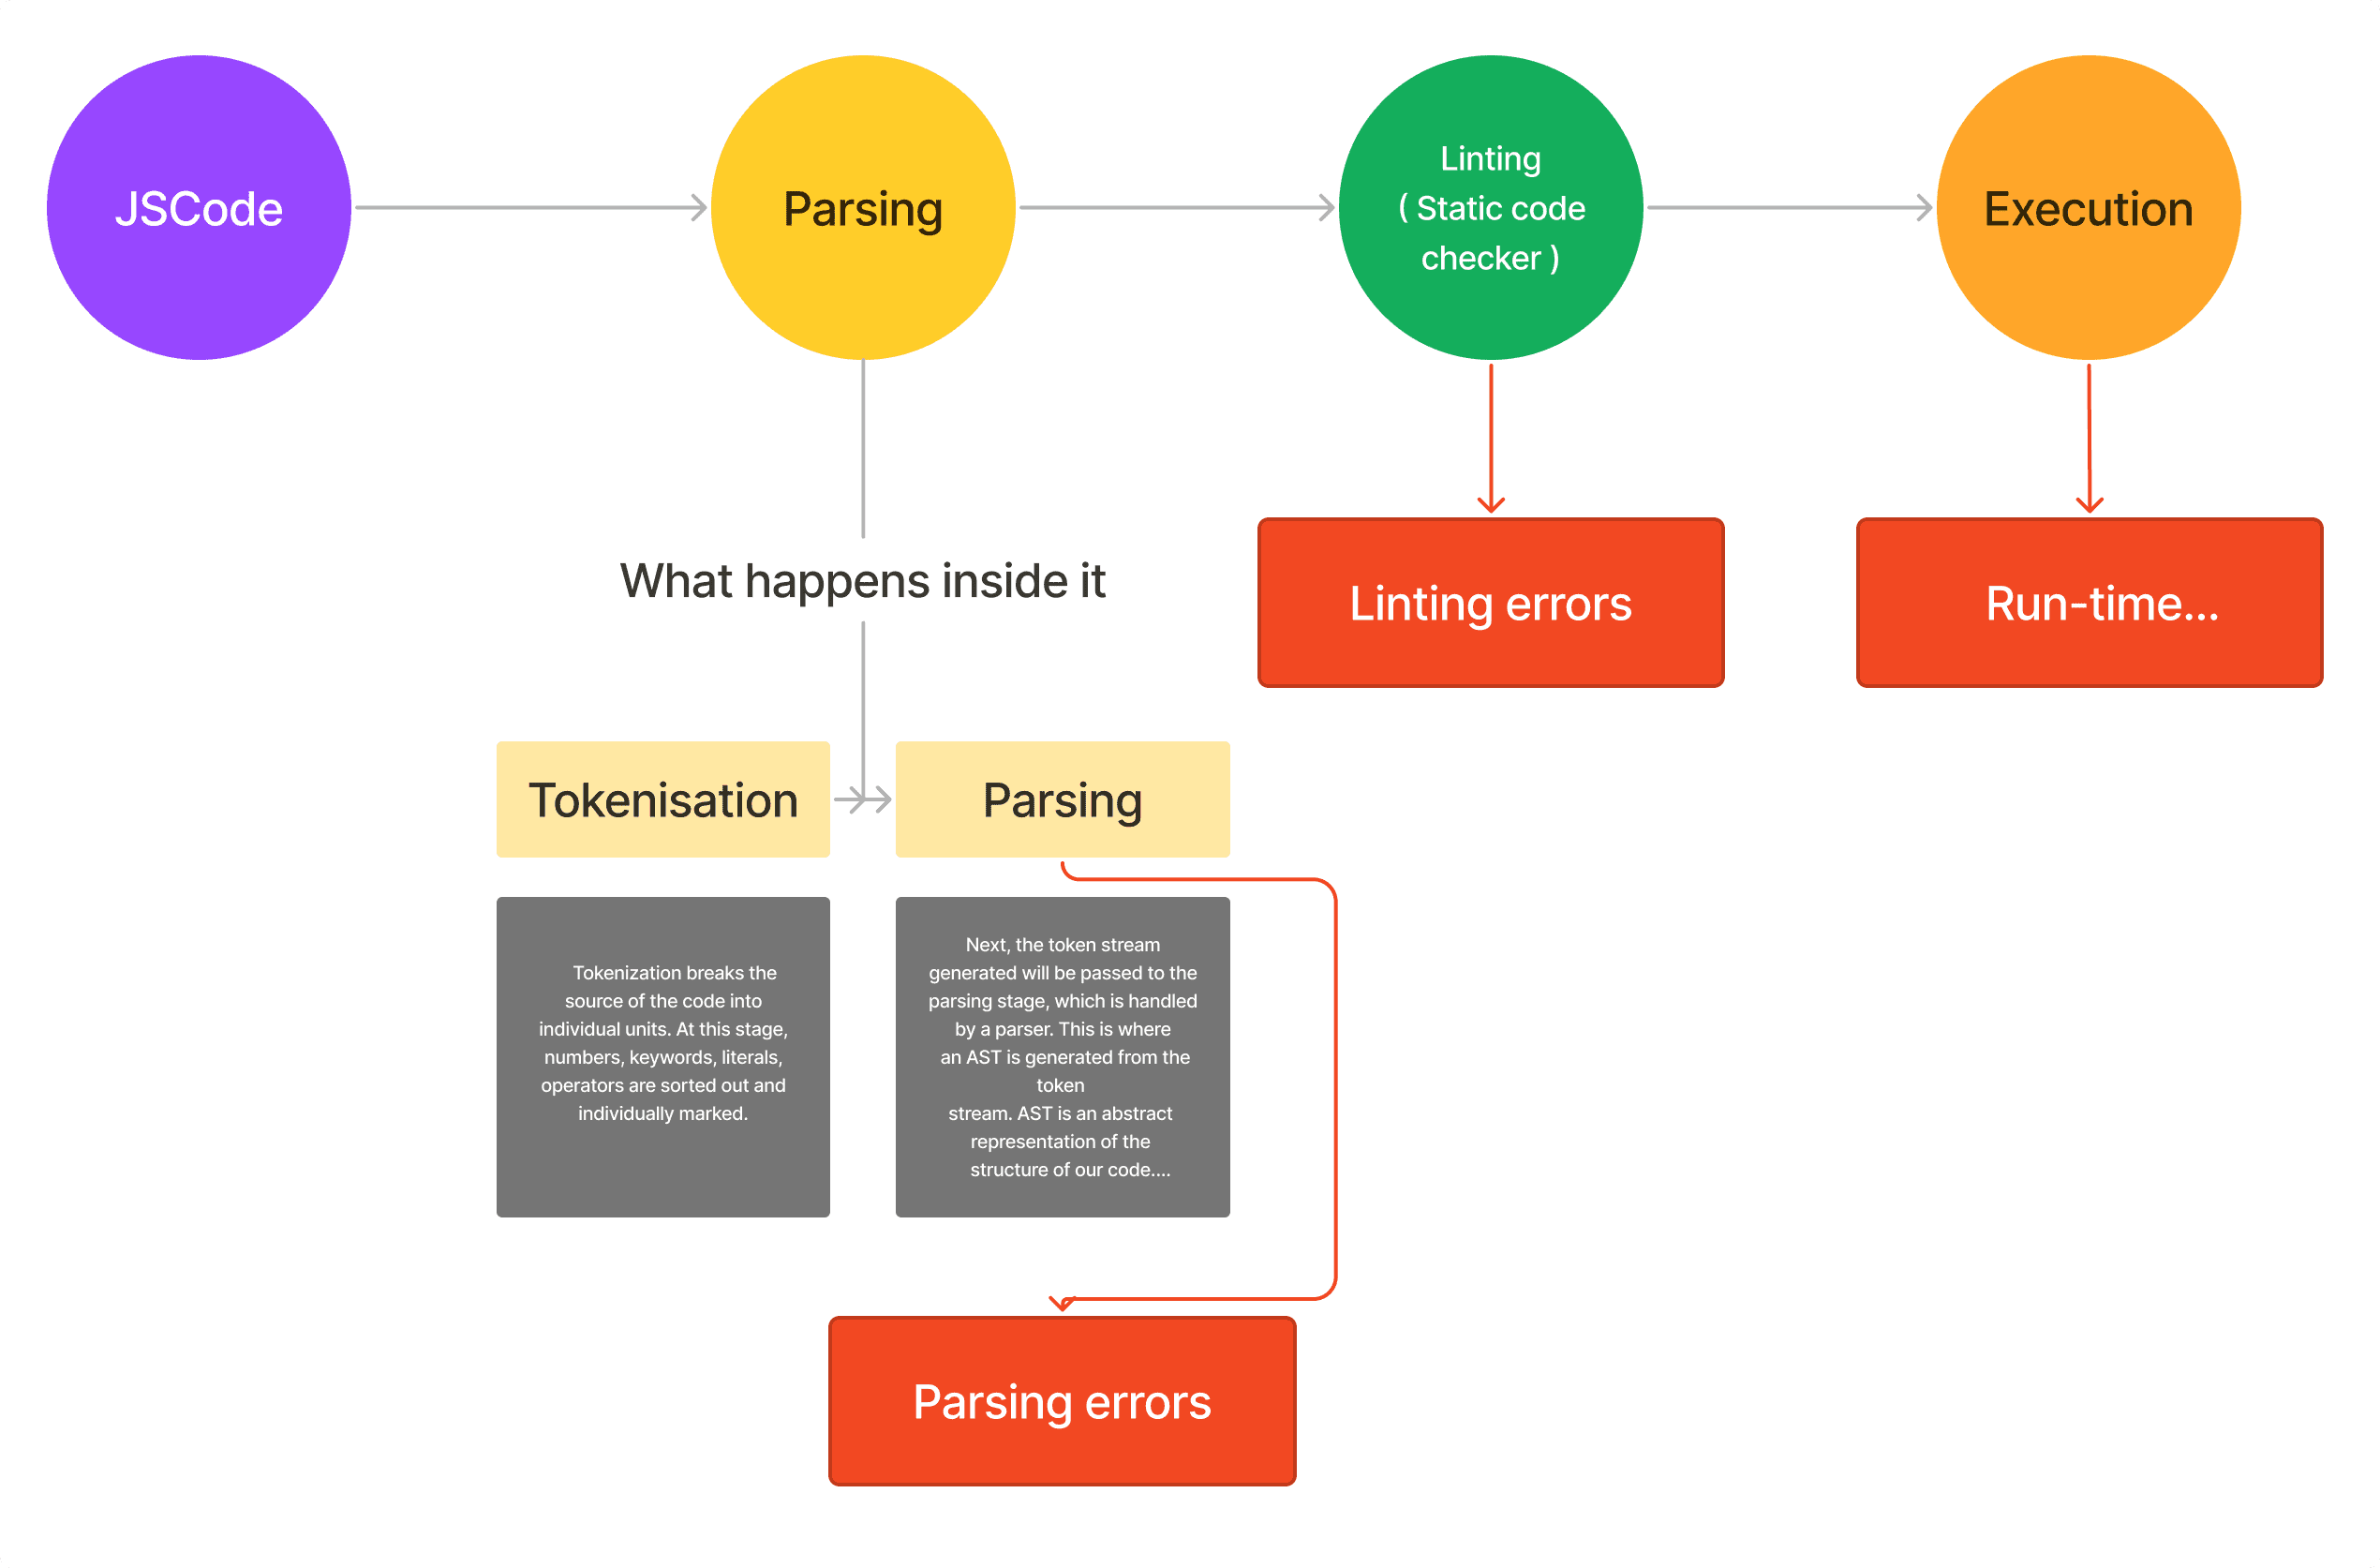
There are 4 main types of errors that happen on Appsmith which maybe user initiated —
Parsing error
Occurs when the JS evaluation fails.

Happens in widget
Validation error
Occurs when JS is valid, but expected types don't match. For example, passing a string as a parameter to table data.

Happens in widget
Linting error
Occurs when JS has syntax errors

Happens in JS Objects, Moustache templates
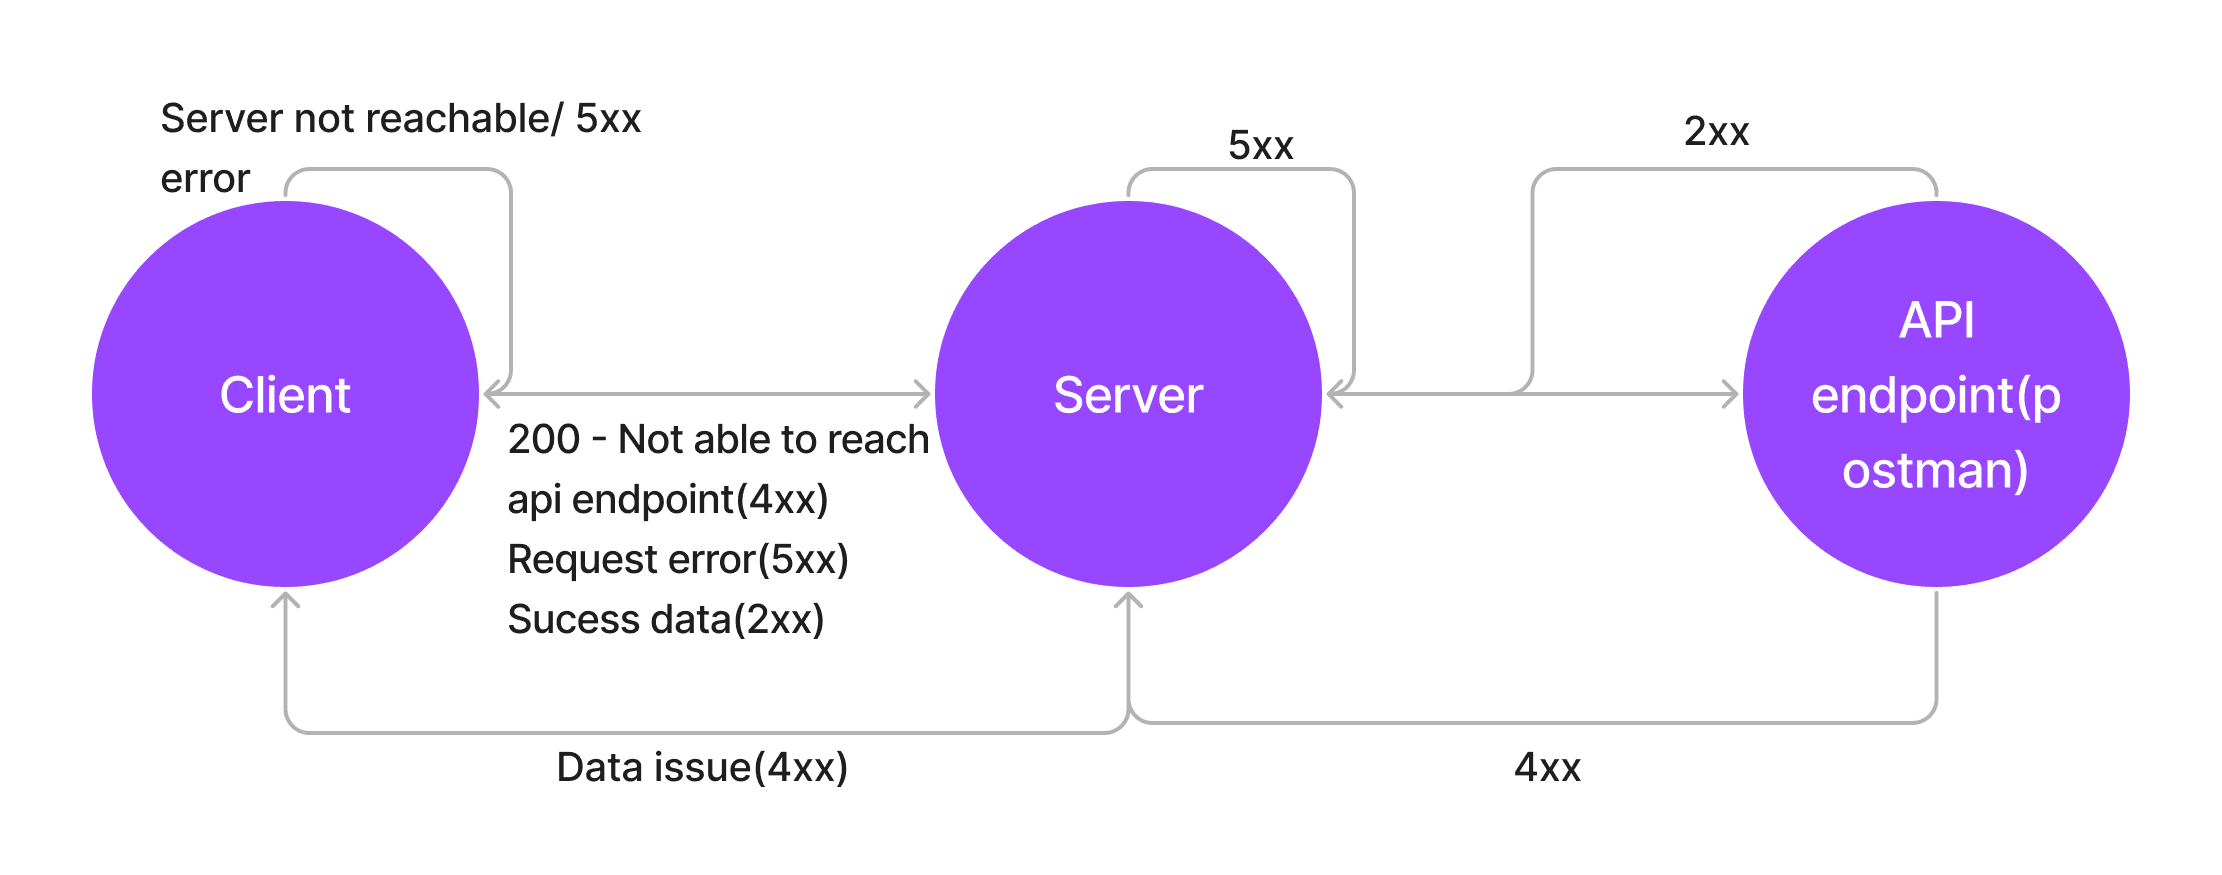
Plugin execution error
Occurs when query execution fails
Happens in Queries/APIs
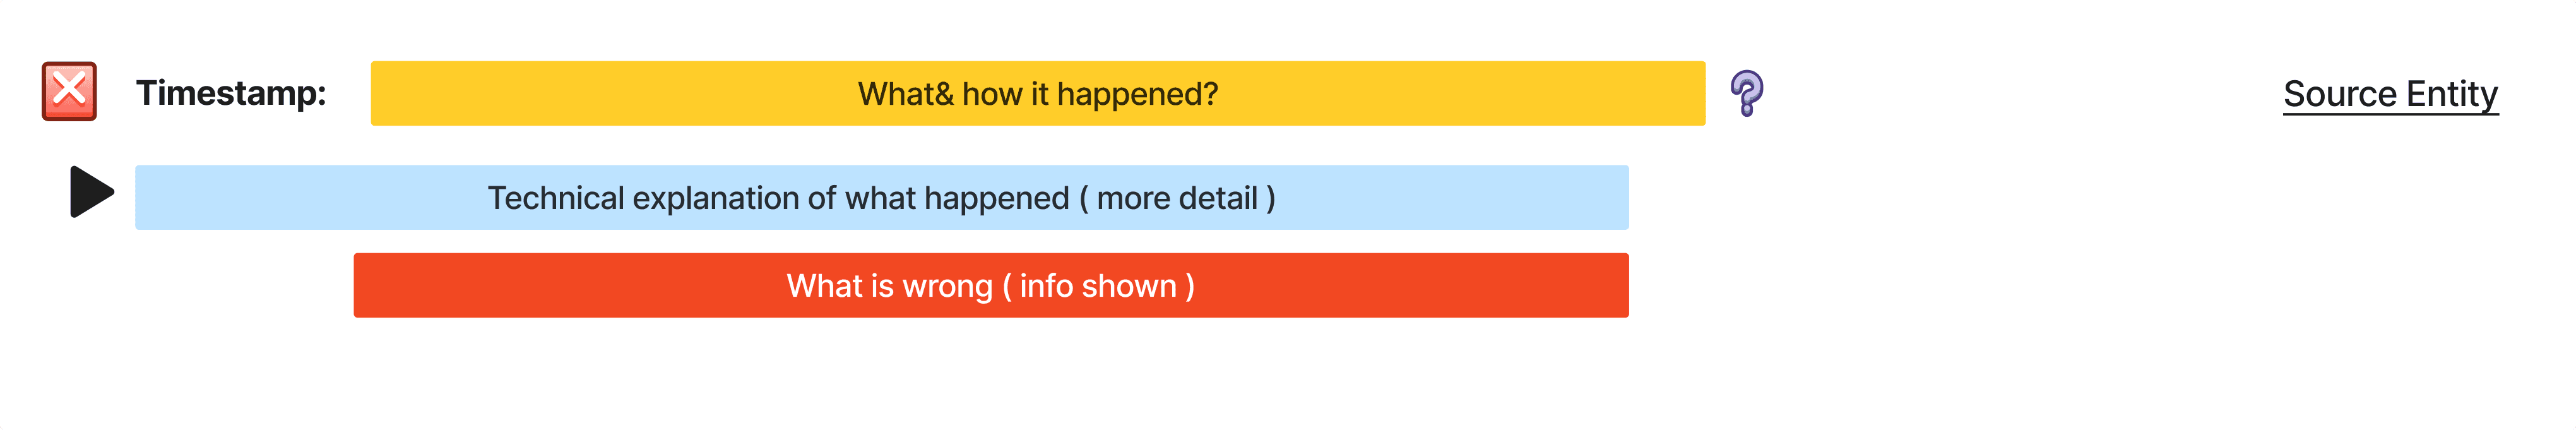
Anatomy of an error
Discovery
Toast message informs the user that there is an error

Navigation
The error is highlighted in the botton right corner of the screen

Details
The users can get more details on the error in the logs
Errors leaderboard
Structure of the errors
Digging more deep into the errors
Trying to understand how these errors occur and how are they related to the other errors we display in the debugger
Error generation flow
Js Object errors generation in backend
Queries/APIs errors generation in backend
The problem
If we follow through the anatomy of the errors, the problems can be defined as —
Error logs data
We defined the error logs data in terms of how many errors are being solved and in how much time
Error resolution % broken down by error types

Average time taken to resolve errors
2.2 hours
Parse errors
2.5 hours
Validation errors
4.3 hours
Plugin execution errors
4 hours
Lint errors
Solving it phase wise
The entire design revamp is so overwhelming for us, so we decided to take one thing at a time and started with format of error logs and Ive completely owned this phase.
Format of error logs
Redirect to error logs
Error discovery
PHASE 1 - FORMAT OF ERROR LOGS
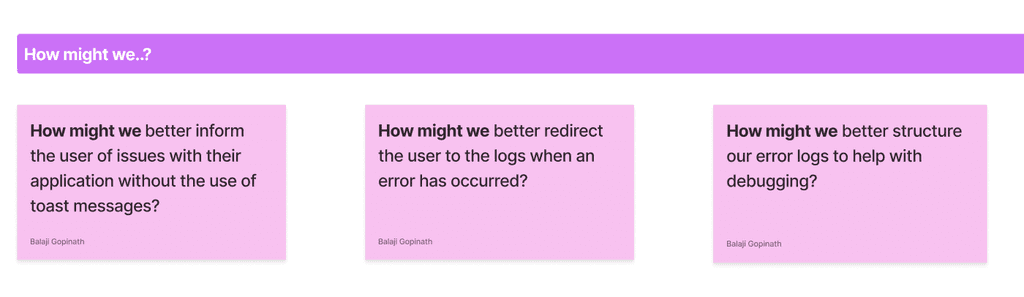
How might we better structure the error logs so that the user gets all the information they need to resolve the error in a short period of time?
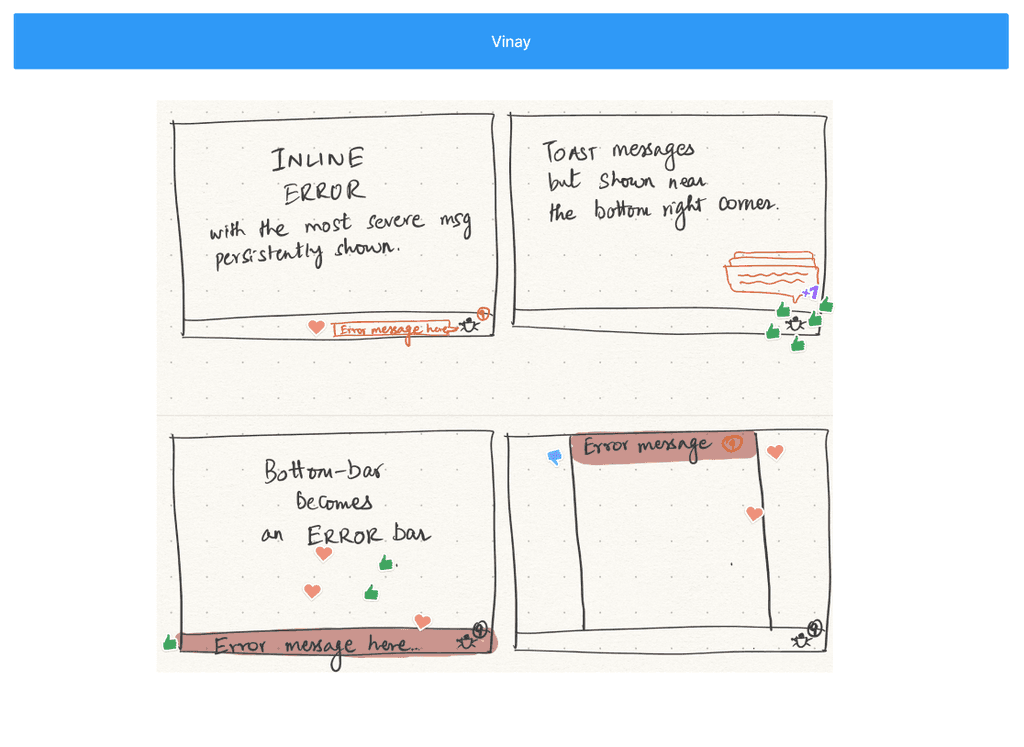
Pod braindrawing exercise
We kicked off debugger ideation with a rapid braindrawing session across pods. Each team member sketched ideas within minutes — sparking diverse, unconventional solutions around error surfacing and log clarity.
HMW's
Ideation by the team


How others are approaching it
Debugger experiences vary, but the best ones prioritise clarity and context — surfacing the why behind a failure, not just the what.


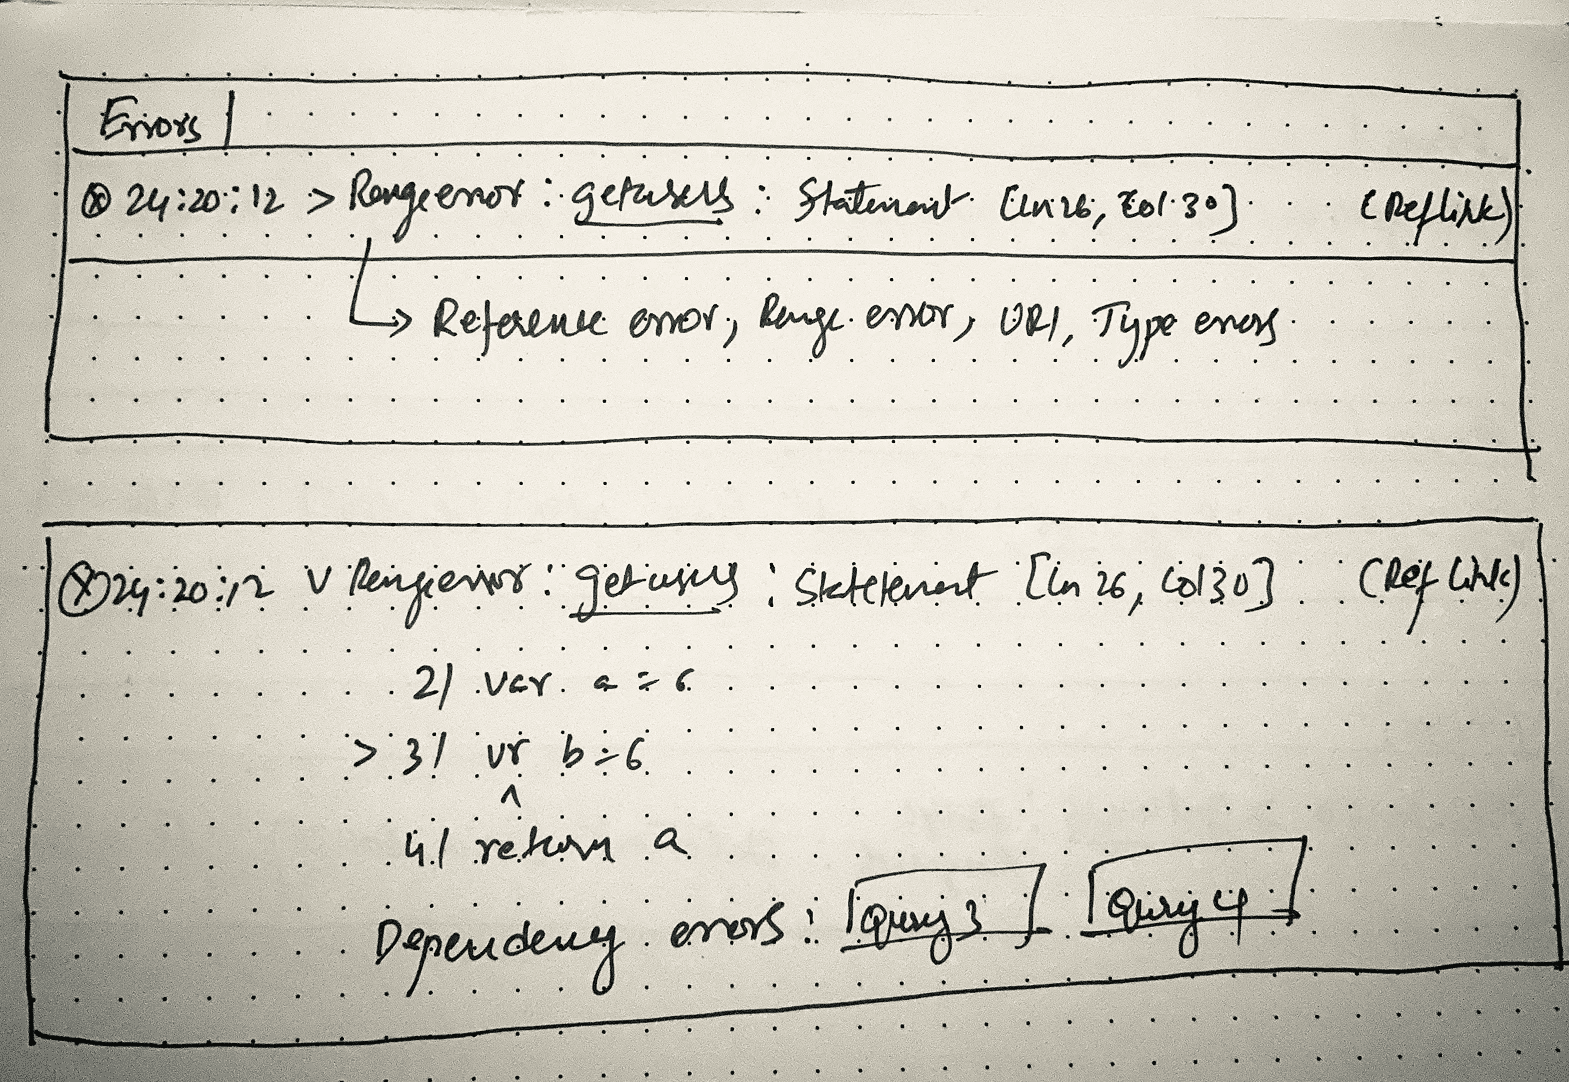
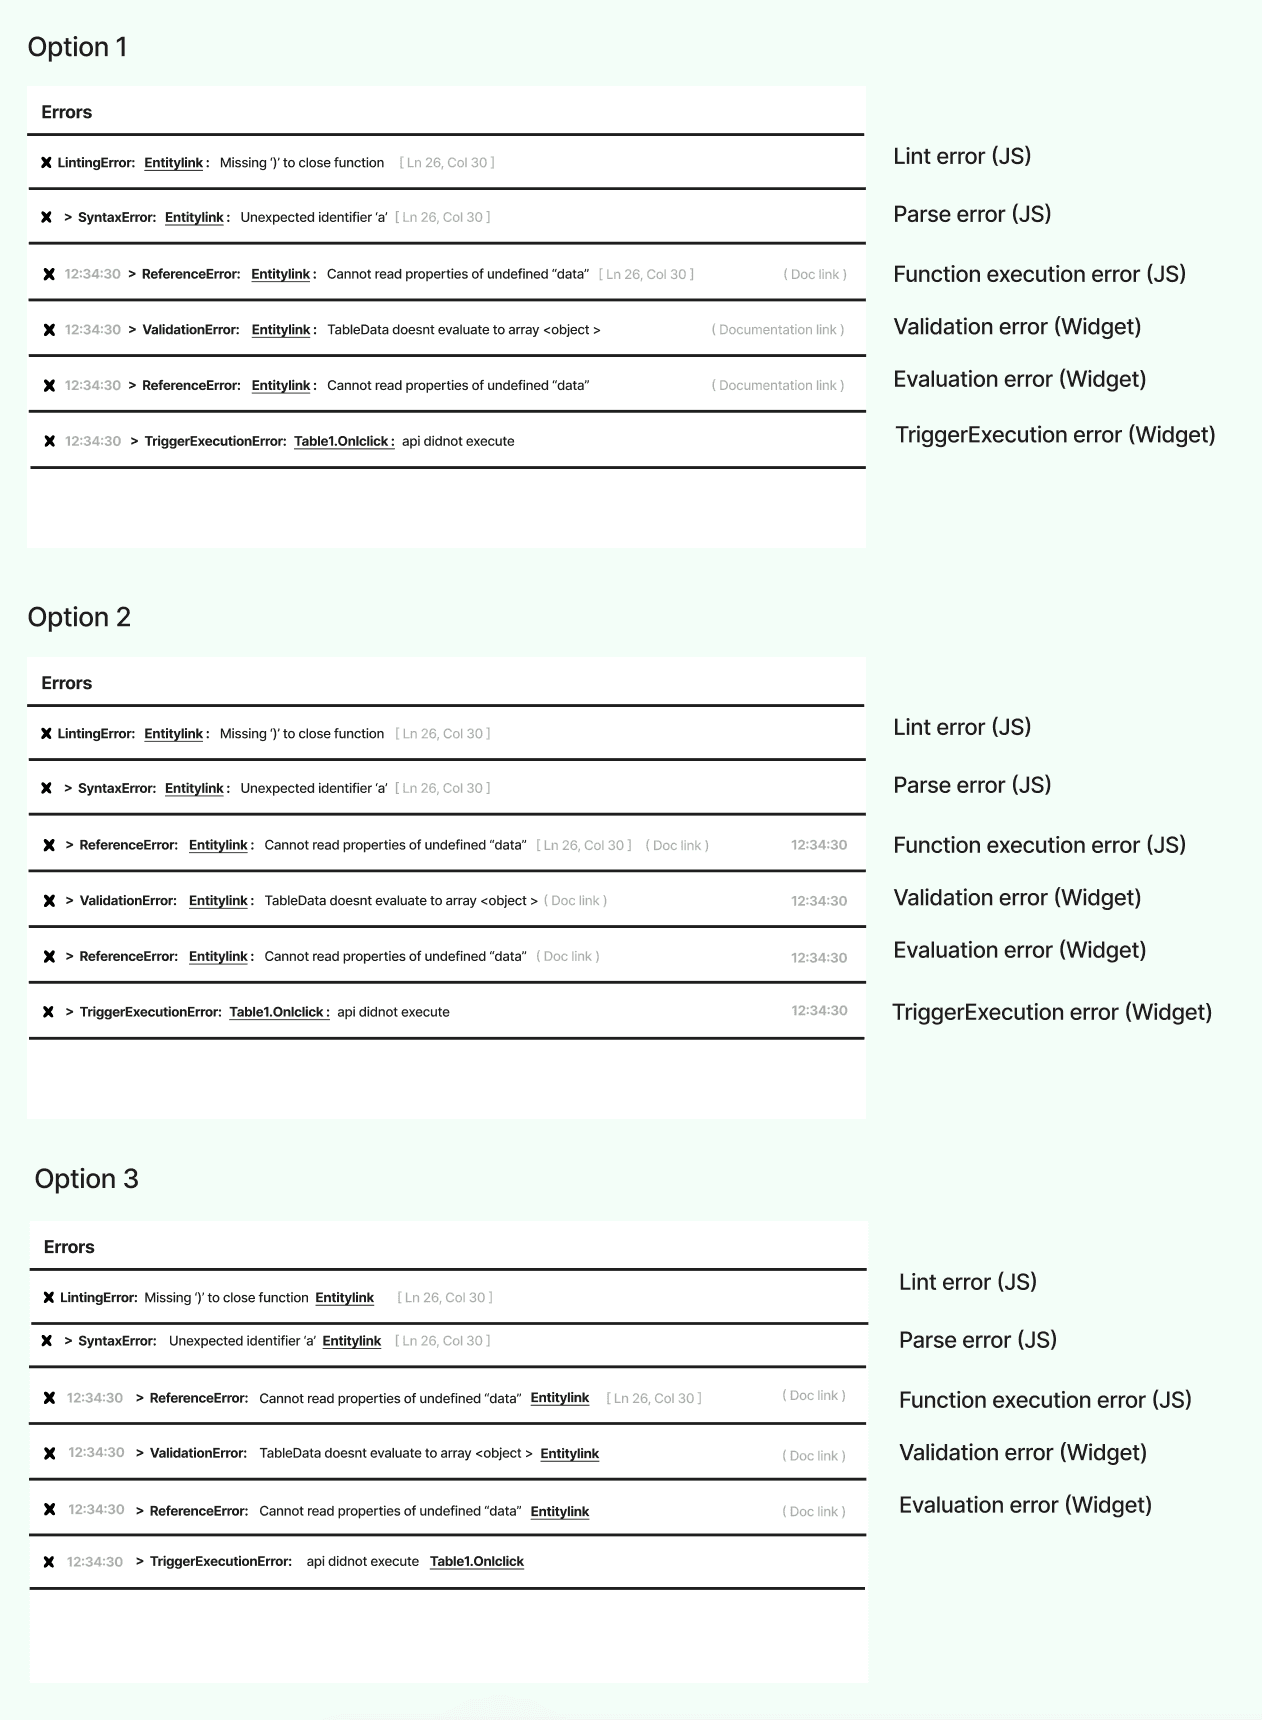
Ideating for each type of error
From JS errors to API failures and widget bindings, we mapped every error type and sketched how they could be discovered, grouped, and explained — pushing for simplicity, visibility, and directness.
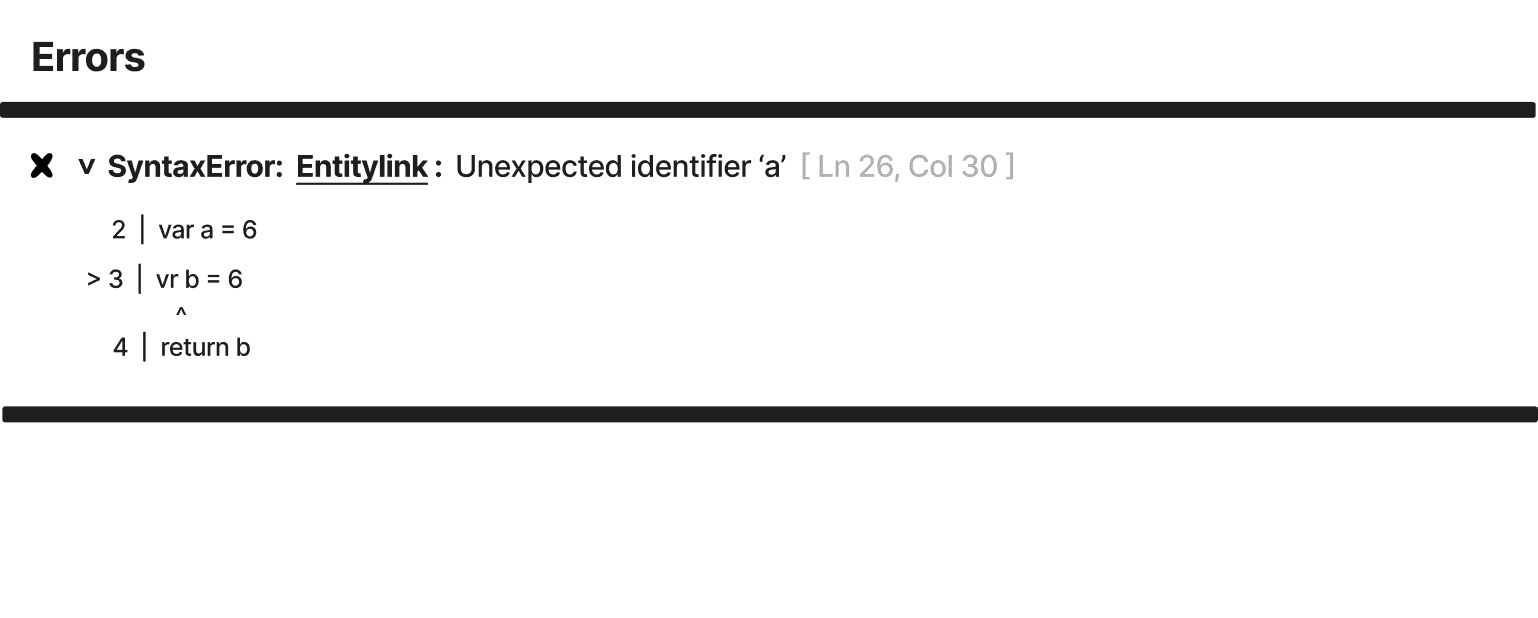
Linting errors
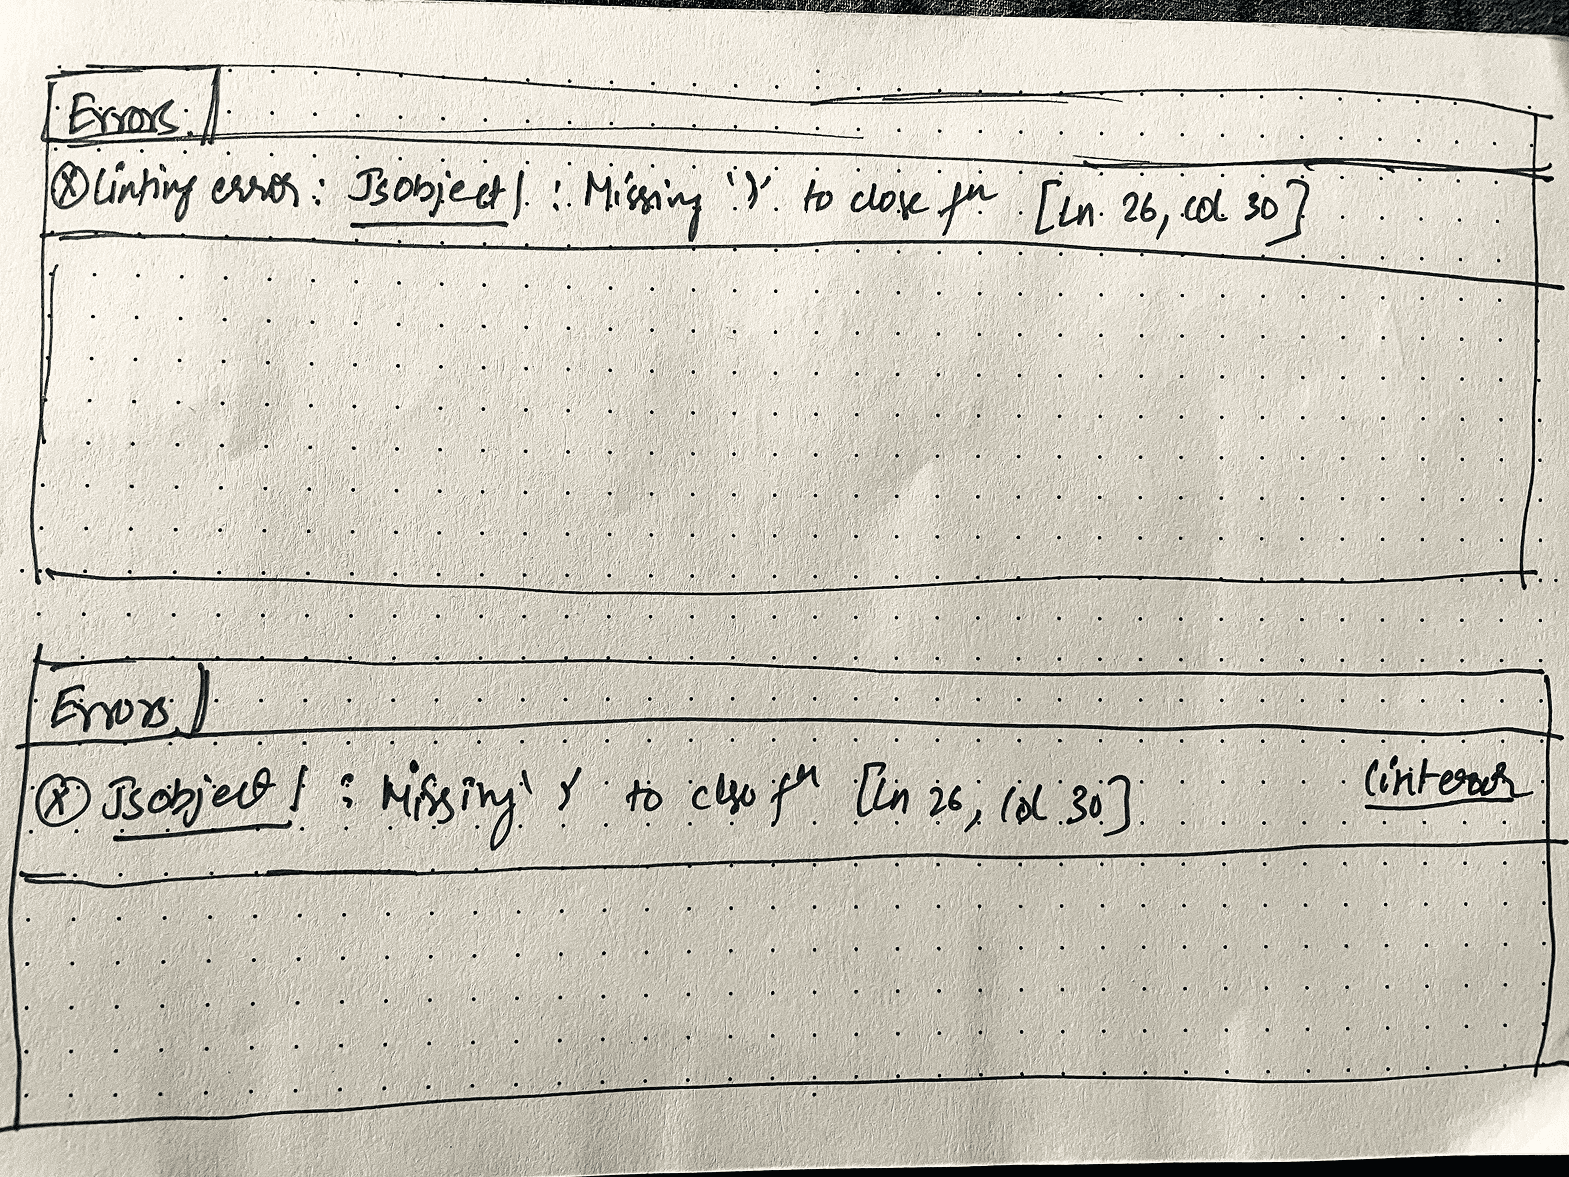

Lint & Parse errors
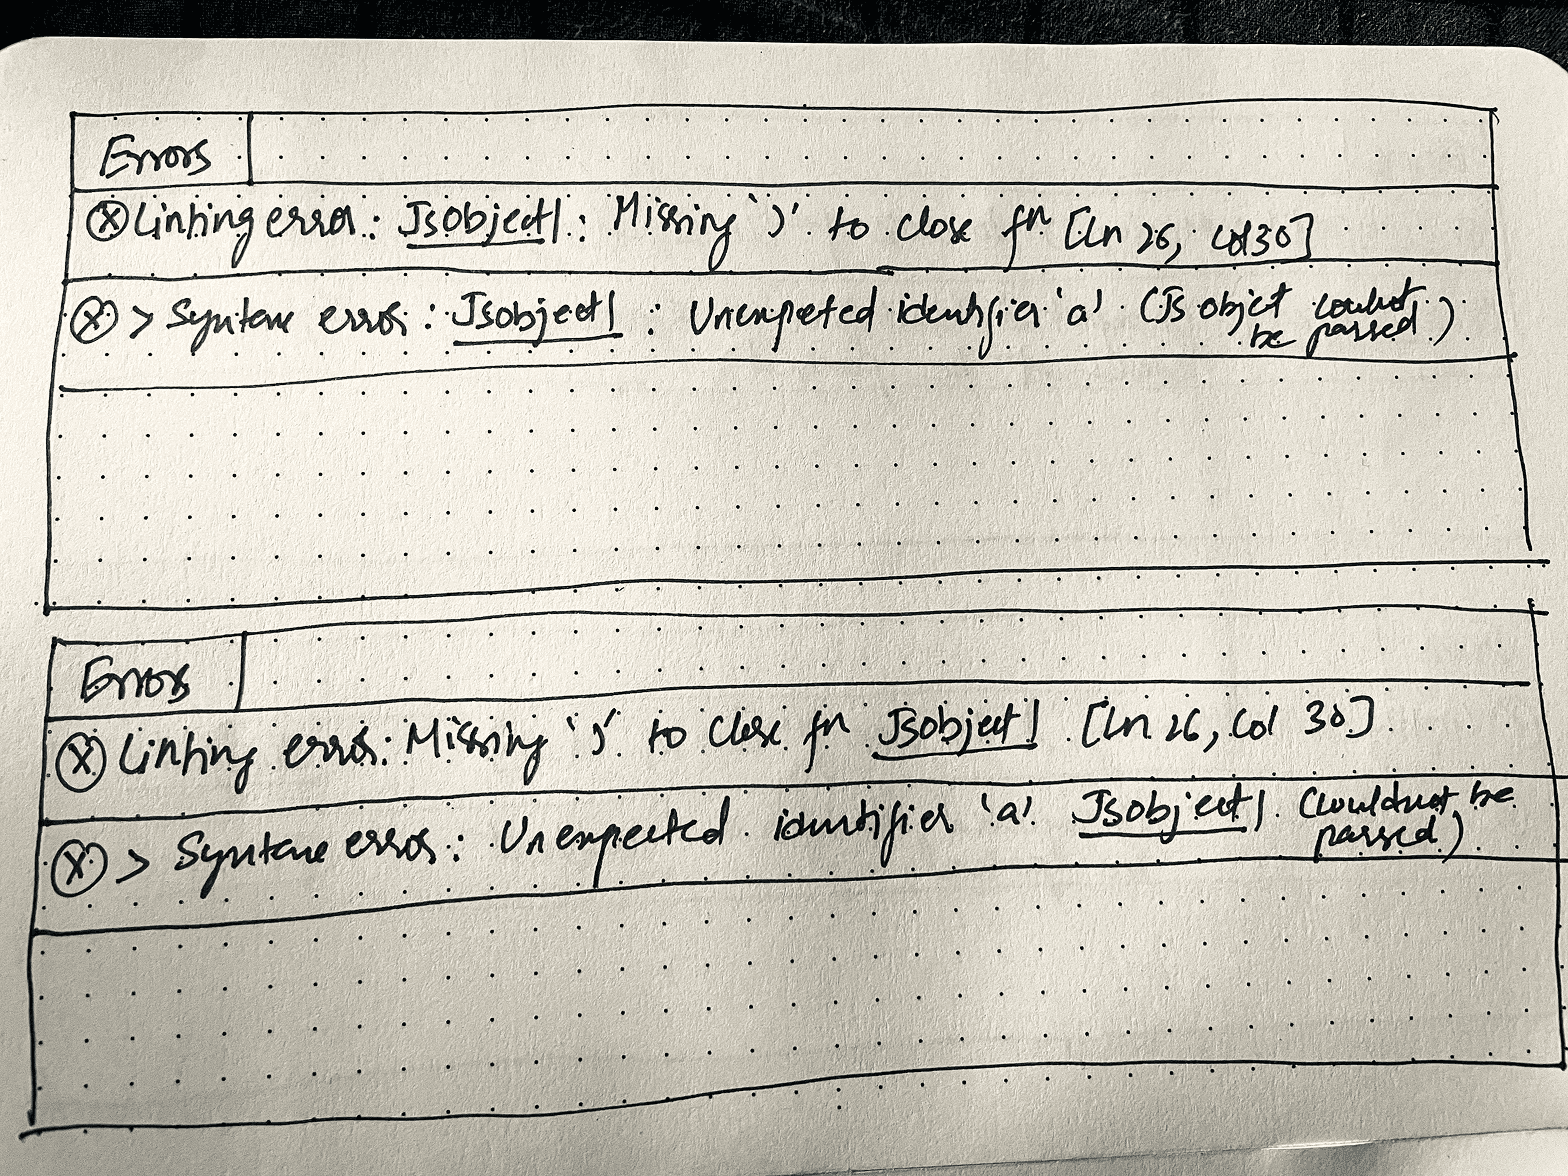

Parse errors
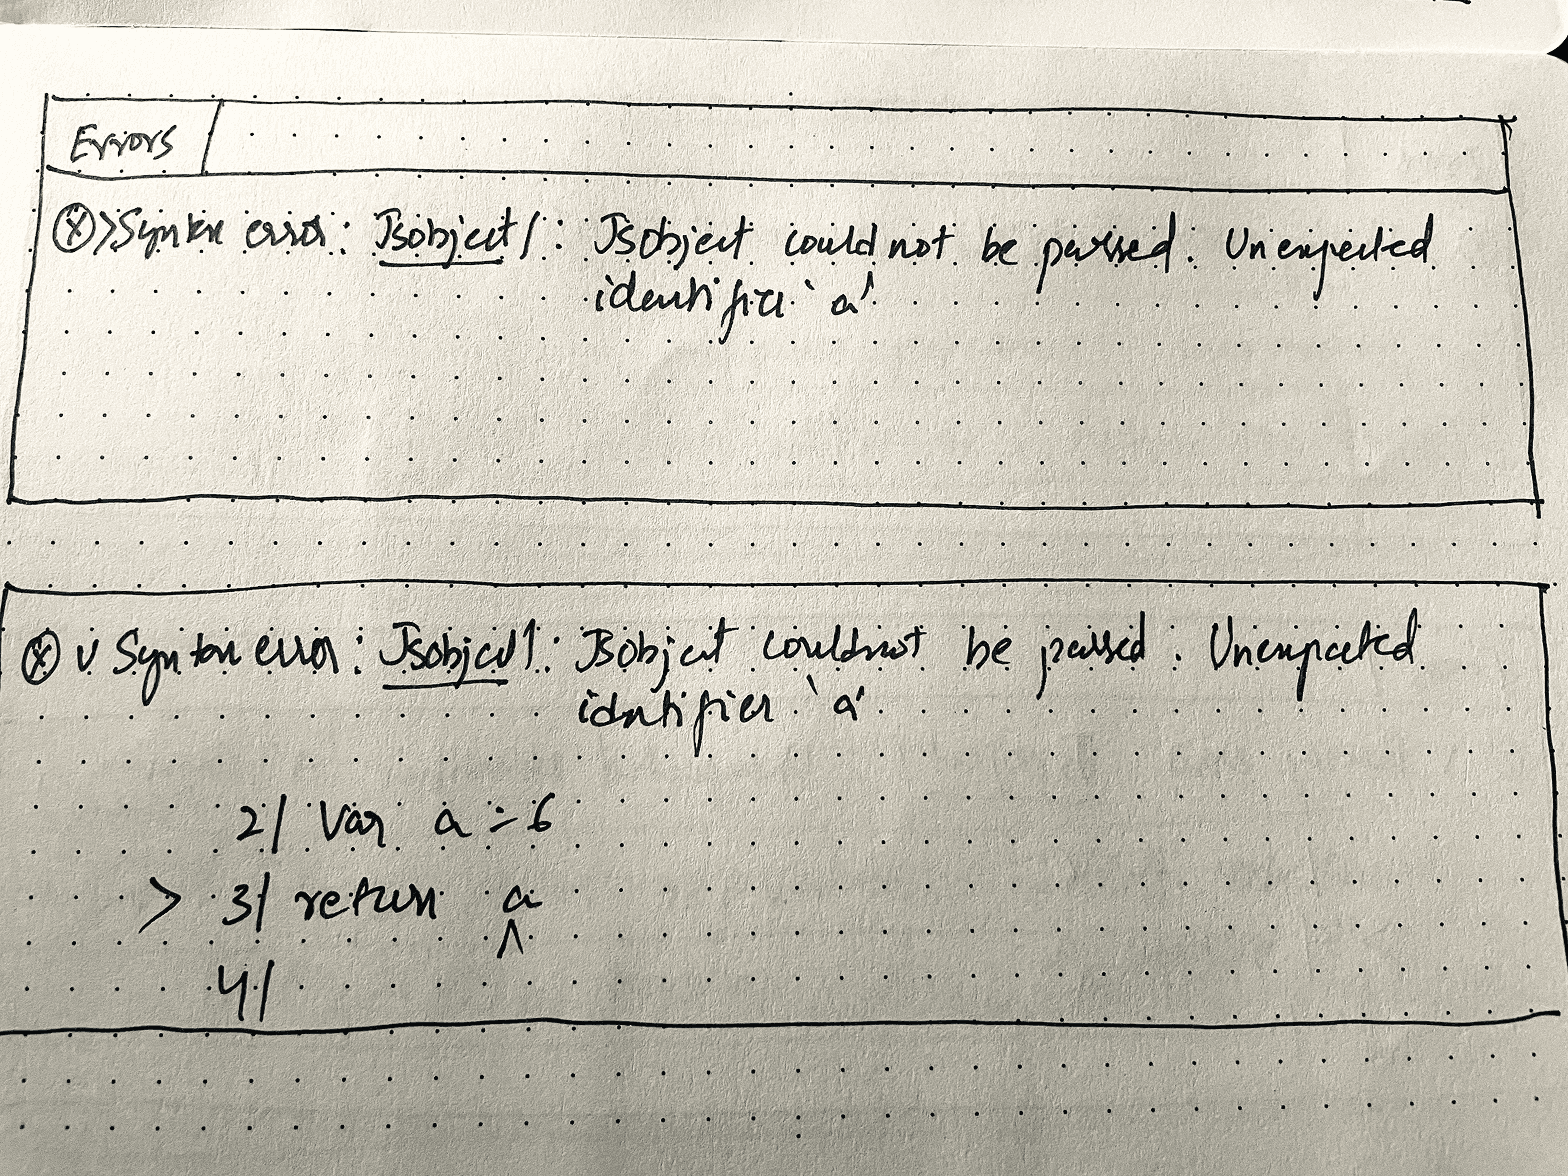
Function execution errors
Evaluation & Plugin execution errors

Widget execution & Validation errors

All together variations
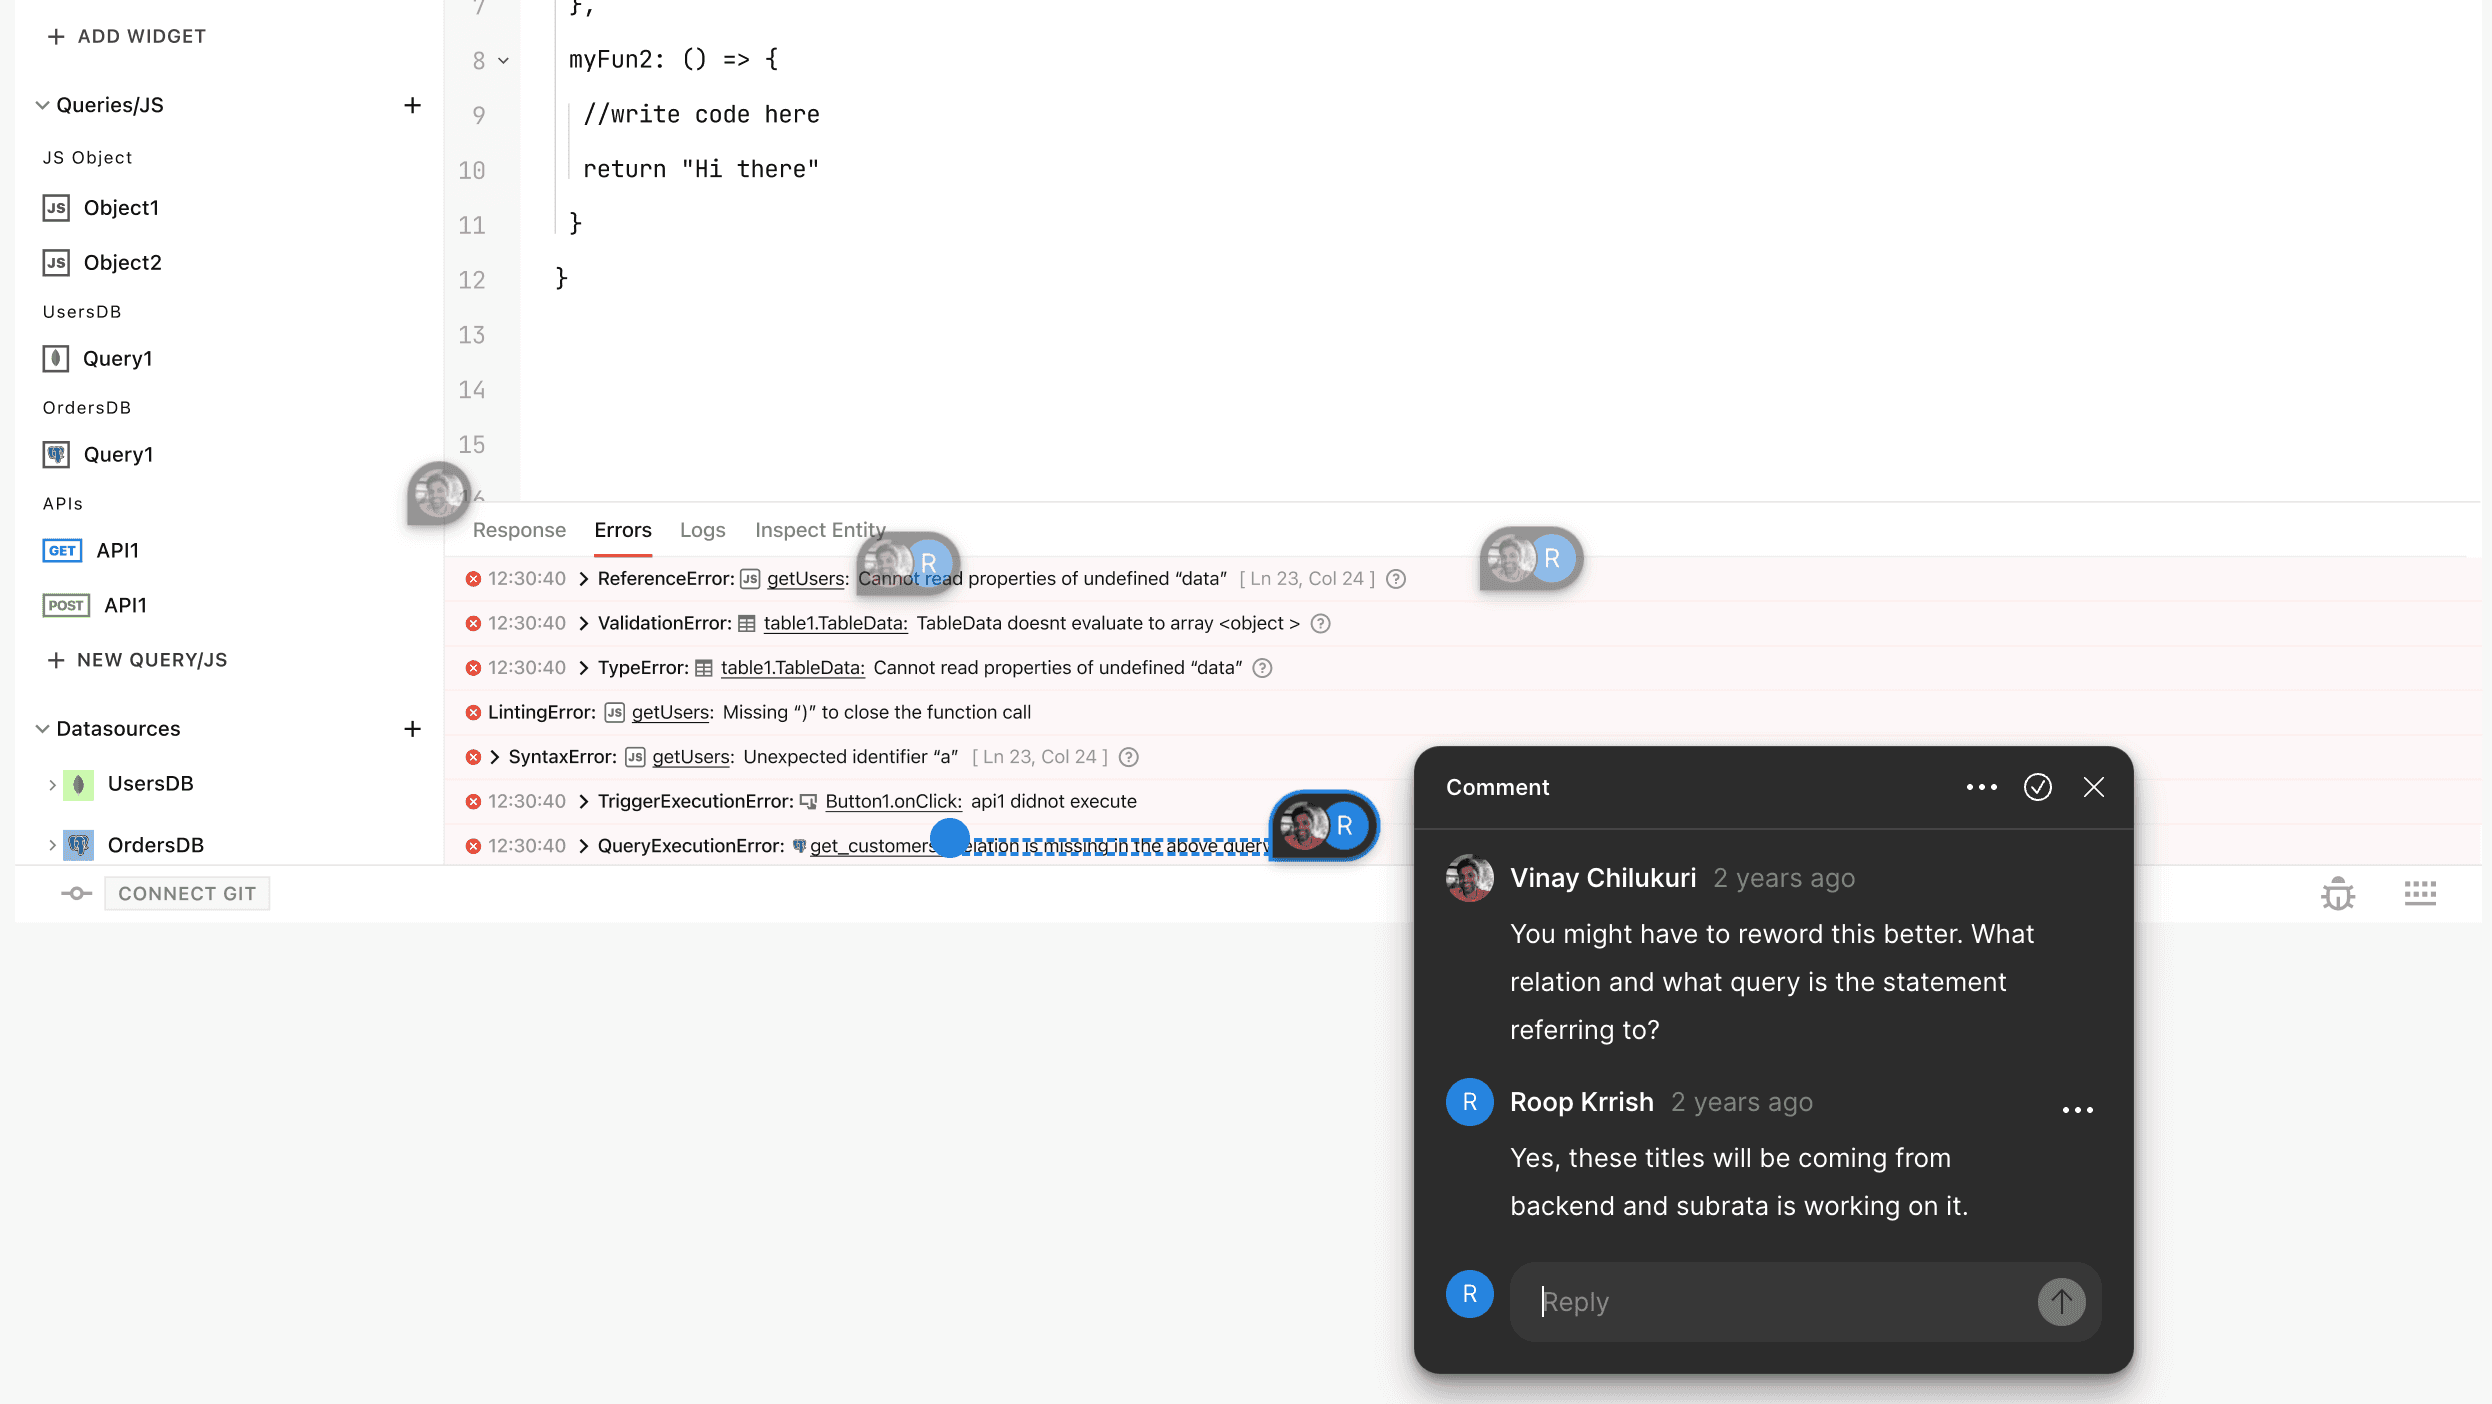
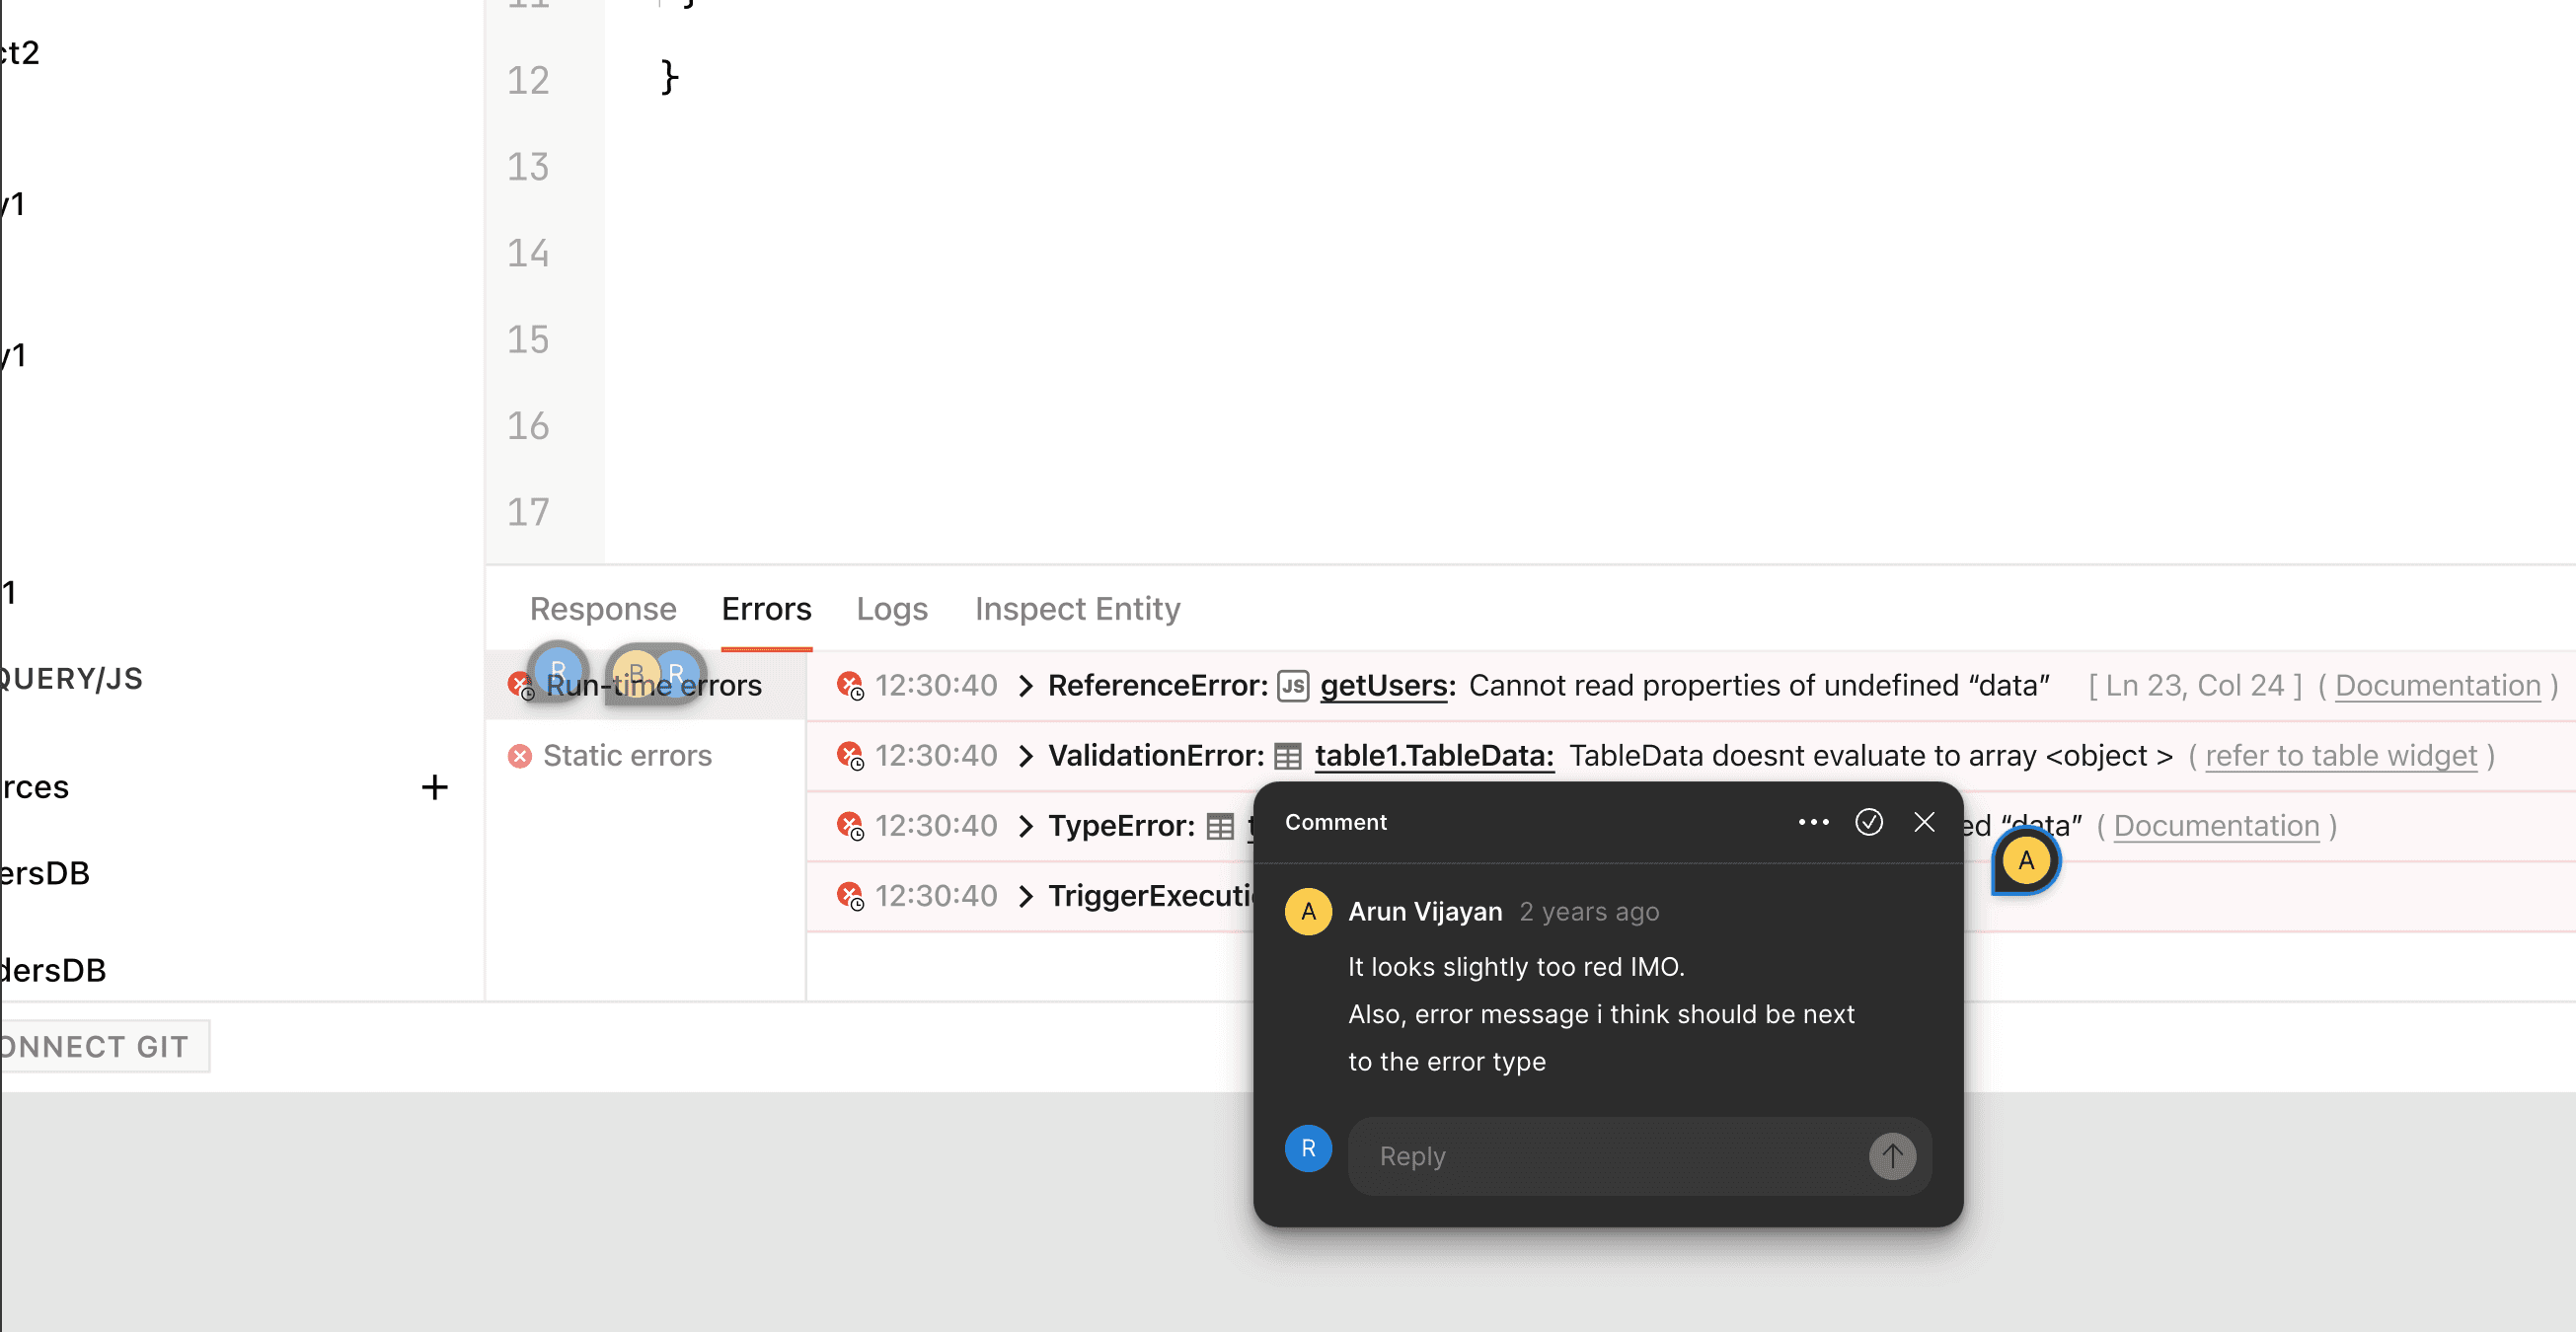
Solution refinements & Feedback
Early prototypes were shared across pods. Feedback from FE Coders, Canvas, and Platform teams helped us iterate on grouping logic, inline error placement, and interaction models.
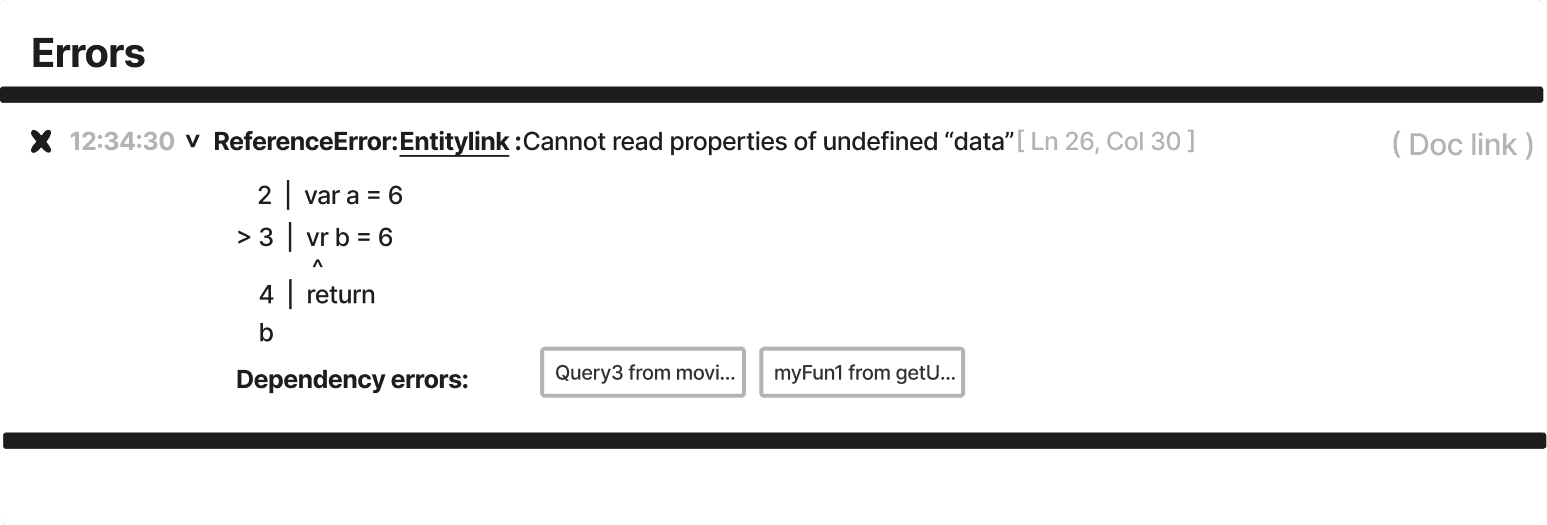
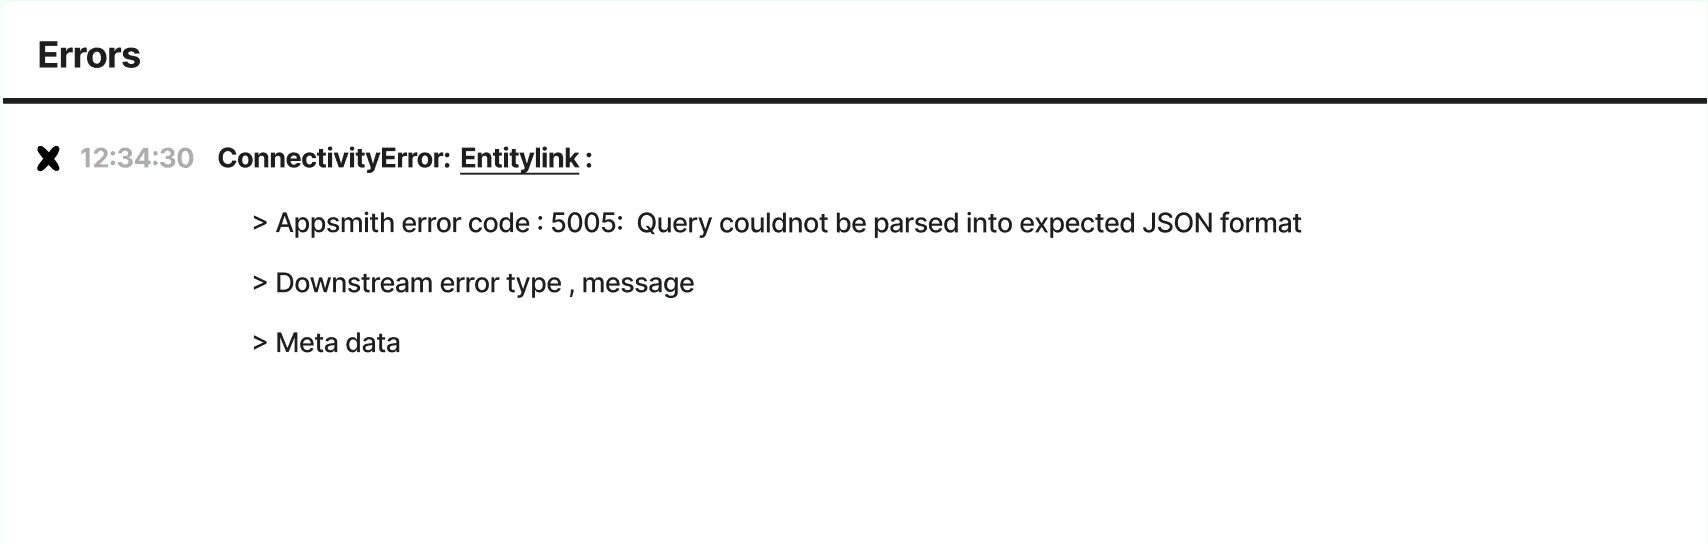
Final designs
The result: a cleaner, contextual debugger that makes errors obvious, actionable, and traceable — with linked sources, grouped logs, and a much calmer UI.
Final screens

Plugin execution error
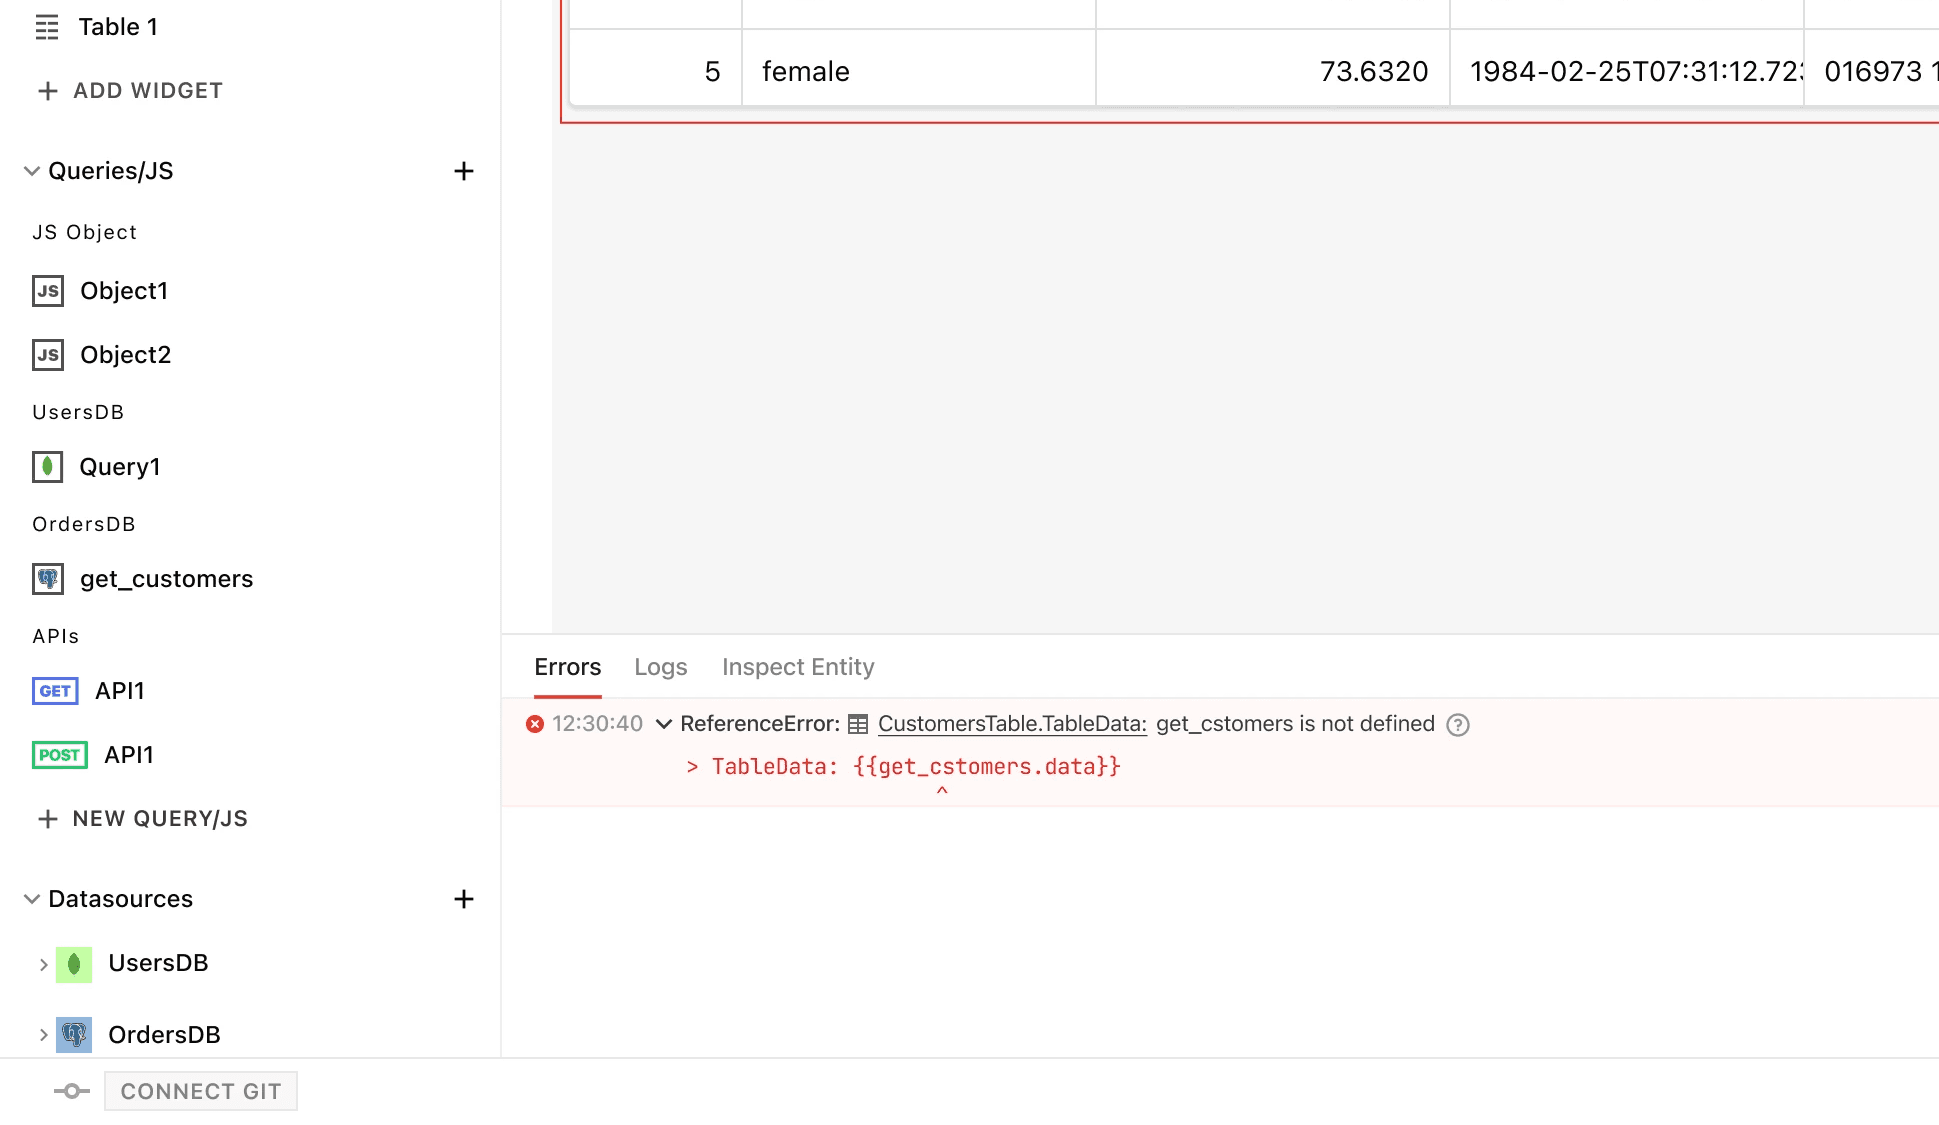
Reference error
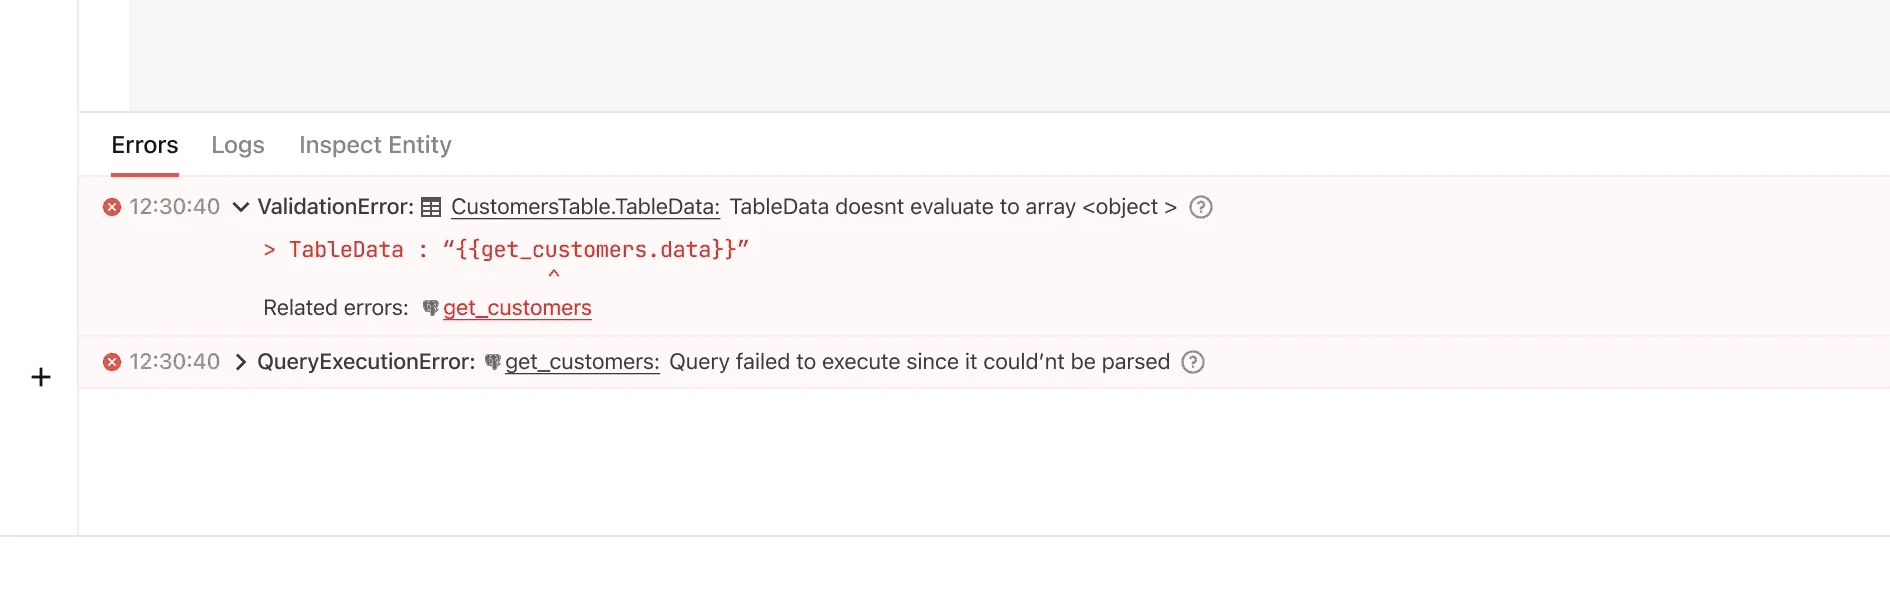
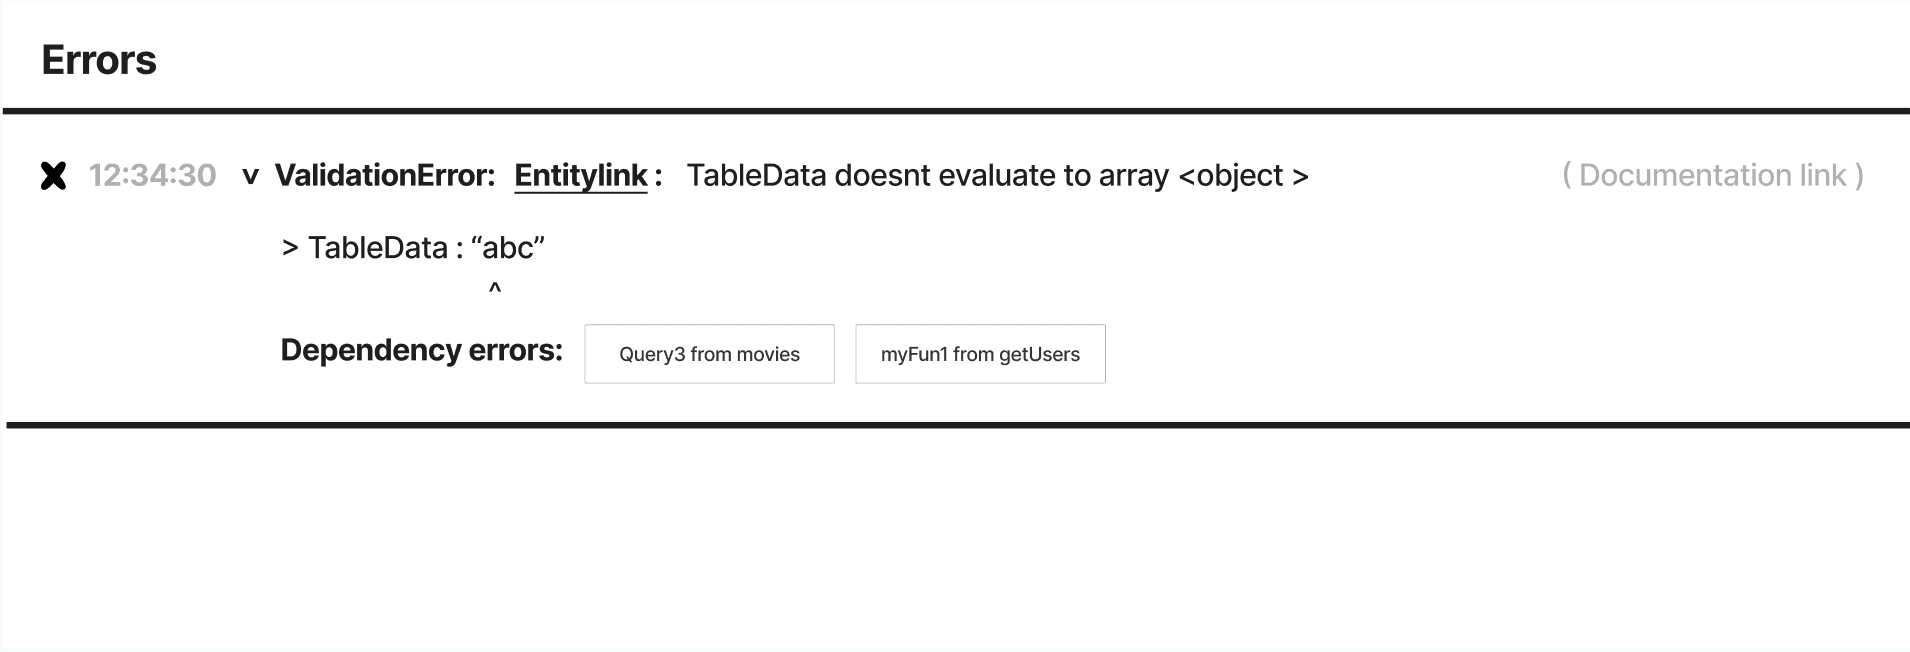
Validation error
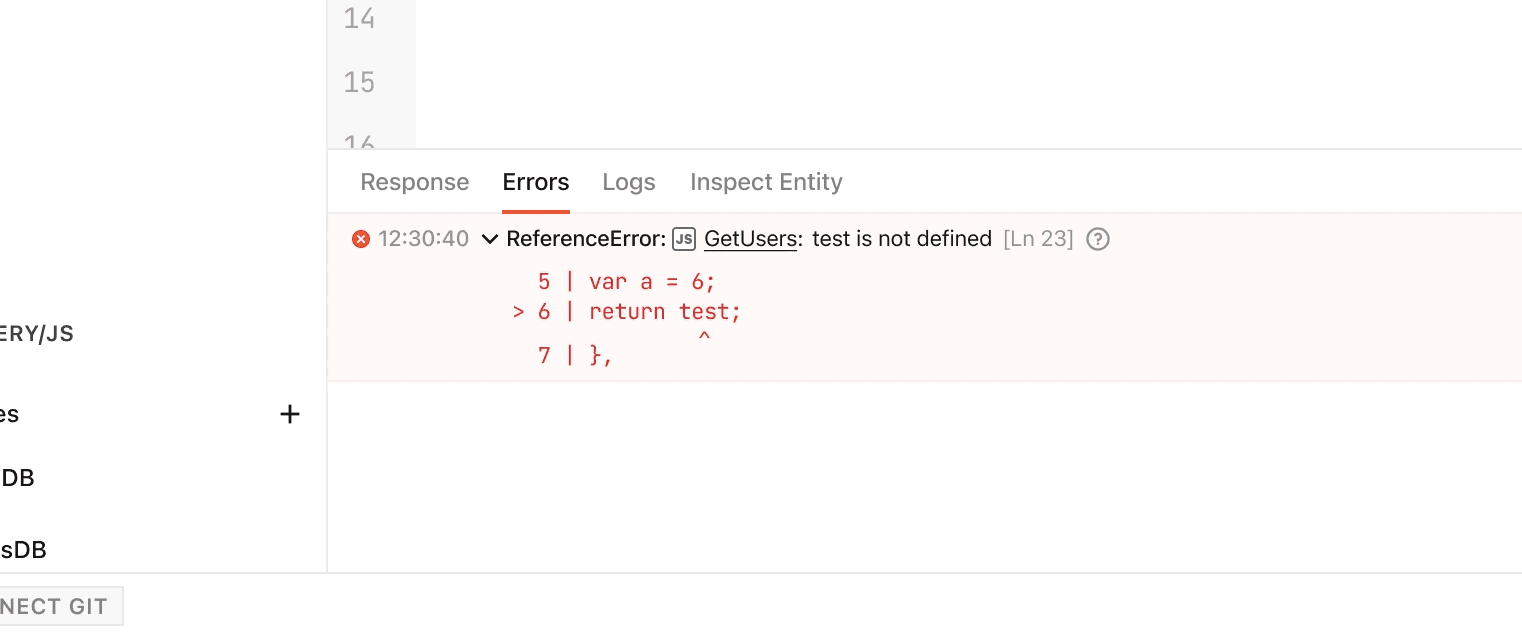
Function execution error
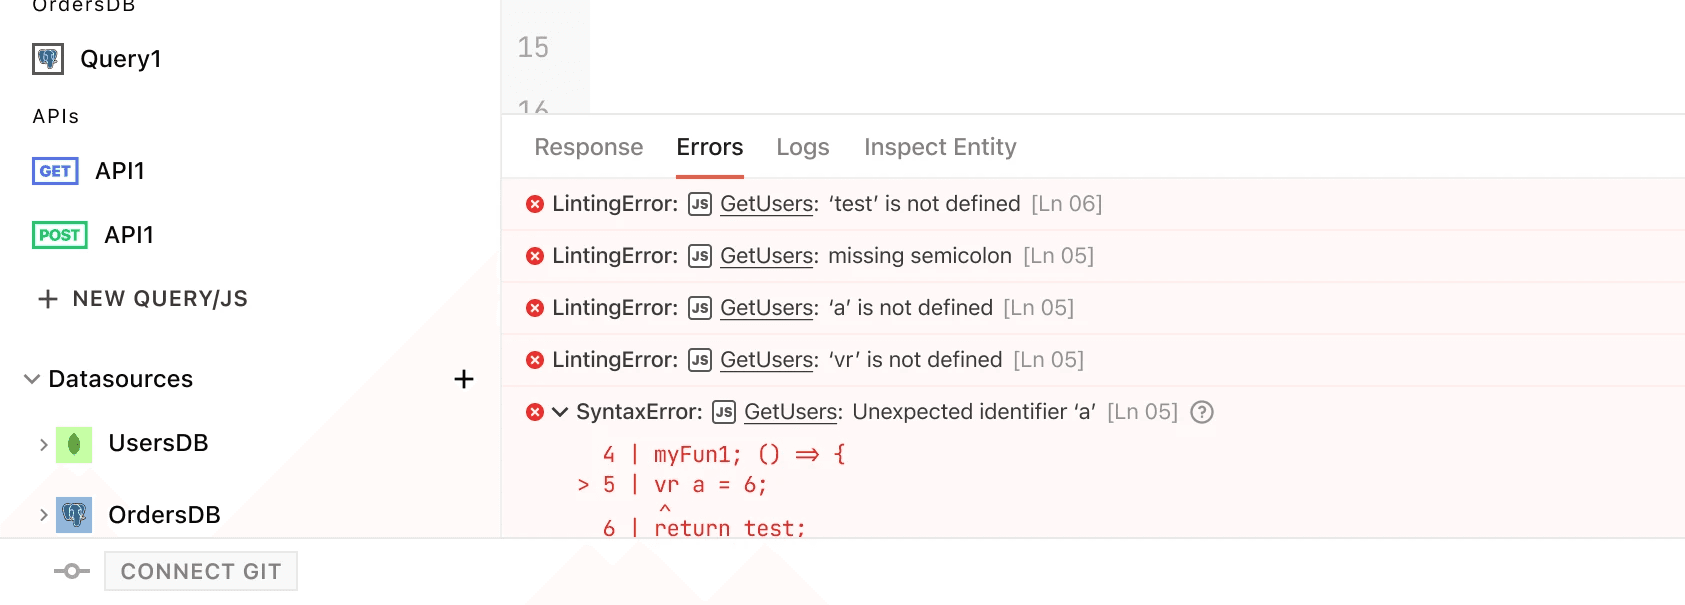
Lint and Parse errors
Before vs After


Website will be revised in actual code soon
@ Roop Krrish 2025